What's New
24 April, 2020
Change of identity: what 2018 Census data tells us about Devonport
Statistics New Zealand recently released a tranche of 2018 Census data.
Jo Hammer looked behind the numbers, to reveal what they tell us about people living on the Devonport peninsula.
The biggest changes on the Devonport peninsula are the ethnicities we identify with and the faiths we practice, according to the Census 2018 statistics. And what makes us some of stand out the most from other regions are our levels of personal income and our travel patterns.
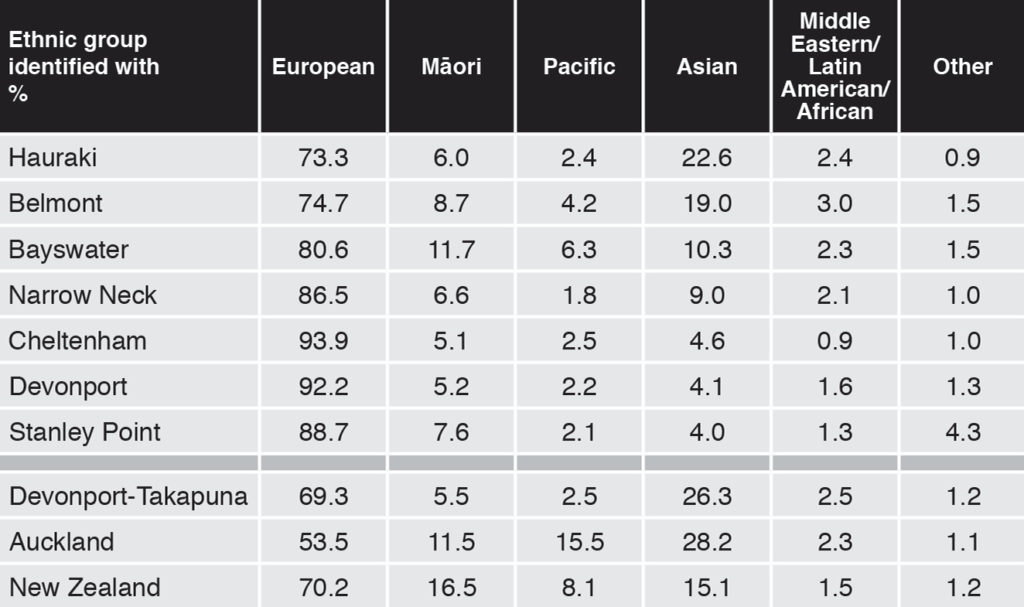
The peninsula is still predominantly European in ethnicity, but its proportion of Asian residents is rising significantly. That trend is most noticeable in Belmont and Hauraki, where the local population with Asian ethnicity has grown by 9 per cent and 6 per centrespectively since the 2013 Census.
The areas with the highest concentration of European ethnicity remain Cheltenham and Devonport. Bayswater closely reflects Auckland as a whole, in its proportion of Māori. It is also home to more Pacific peoples than the rest of the peninsula, and the Devonport-Local Board (DTLB) area as a whole.
Birthplace
Just over half (56.2 per cent) of DTLB residents were born in New Zealand, sig- nificantly lower than the proportion of the country’s total population (72.6 per cent). The proportion of peninsula residents born in New Zealand ranged from 59.4 per cent (Hauraki) to 66.5 per cent (Narrow Neck).
Residents born in the UK and Ireland, and the rest of Europe, are over-represented on the peninsula and in the DTLB area, compared to Auckland (7.9 per cent) and New Zealand (7.8 per cent). Cheltenham, Devonport and Stanley Point each have more than 18 per cent born in the UK and Ireland. The proportion of residents born in Asia was highest in Hauraki (18.1 per cent) and Belmont (14.4%).
Returning from overseas
One in twenty residents of Stanley Point and Hauraki were living overseas in the year prior to the 2018 Census, twice the proportion of those from Cheltenham. Overall, 4.8 per cent ofDTLB residents were overseas the previous year..
Religious affiliation
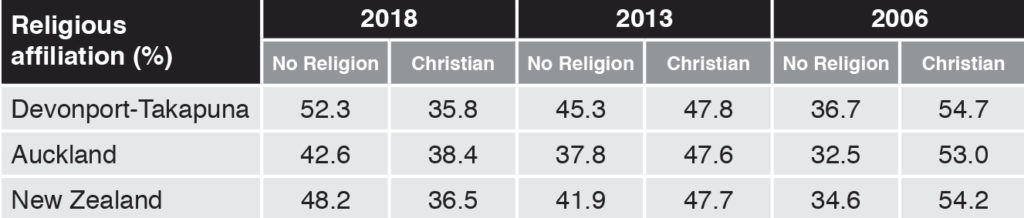
The peninsula and the wider DTLB area are consistent in a marked increase over the years of those practising no religion, and a sharp decrease in those with an affiliation to Christianity.
The proportion of DTLB residents with no religious affiliation has grown by 7 per cent since 2013, and 15.6 per cent since 2006.
Correspondingly, the affiliation to Christi- anity has decreased by 12 per cent and 18.7 per cent respectively over the same period.
The peninsula showed a little variability, with Hauraki, Cheltenham and Belmont reflecting the trend to ‘no religion’ the most since 2006, and Devonport having the smallest decline in affiliation to the Christian faith.
Local population
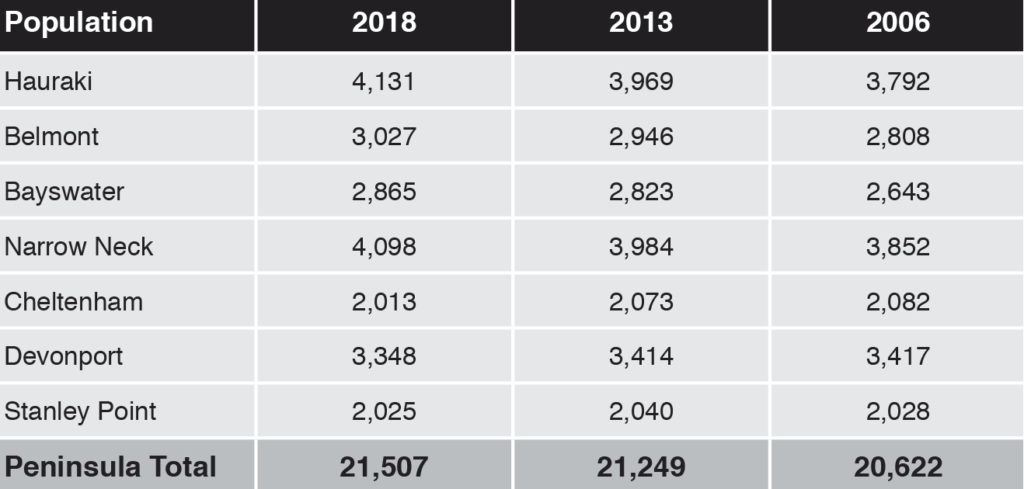
The Devonport peninsula saw a 1.2 per cent overall increase in population since the 2013 Census, from 21,249 to 21,507.
The highest growth since 2013 came from north of the golf course, with the population of Hauraki up 4.1 percent, Narrow Neck up 2.9 per cent and Belmont 2.7 percent.
Age
The DTLB area (39.4 years), and peninsula areas, have a higher than average median age than both Auckland (34.7) and New Zealand as a whole (37.4).
The oldest peninsula residents are in Cheltenham, with a median age of 47.5, followed by Devonport (45.5) and Narrow Neck (40.8). Hauraki, Bayswater and Stanley Point most closely reflect the national median age, while Belmont has the youngest median age on the peninsula, at 35.4.
Devonport has the highest proportion of over-65s on the peninsula, where male and female seniors constitute 18.1 per cent and 19.1 per cent of the population respectively.
Marital status
Just over half (52.5 per cent) of DTLB adults are married, a slightly higher rate than Auckland (49.8 per cent) and New Zealand as a whole (48.6 per cent).
The highest proportion of married couples on the peninsula is in Cheltenham (56.2 per cent) and the lowest in Belmont (48.1 per cent) and Bayswater (48 per cent).
Devonport has the highest proportion of divorced and separated, at 11.9 per cent.
Children
The proportion of women having one or more children is highest in the Cheltenham area (73.9 per cent) and lowest in Hauraki (65.4 per cent), which is similar to Auckland. The overall proportion of women having children is higher at a national level (69.2 per cent) and in the DTLB area (67.2 per cent).
Smoking
The proportion of regular smokers on the Devonport peninsula is in line with figures for the DTLB area (5.8 per cent) and lower than the corresponding rates for Auckland (11.3 per cent) and New Zealand (13.2 per cent) as a whole.
Belmont (7.2 per cent) and Bayswater (6.8 per cent) have the highest proportions of regular smokers, although Bayswater has also made the greatest strides on the peninsula in reducing these numbers, going down from 18.8 per cent in 2006 and 10.5 per cent in 2013.
Hauraki has the highest proportion of those
who have never smoked (74.9 per cent) and Cheltenham and Devonport have the highest proportions of ex-smokers (both 23.2 per cent).
Personal income
All areas on the peninsula had higher median levels of income than the DTLB area, Auckland and New Zealand as a whole. The highest median personal income was in Stanley Point ($47,800) and the lowest in Belmont ($42,100).
The proportion earning more than $100,000 was nearly one in four for Stanley Point, Cheltenham and Devonport, and one in five for Bayswater. For Hauraki, Belmont and Bayswater, it was around 17 to 18 per- cent. This compares to 15.9 per cent for the DTLB, 9.5 per cent for Auckland and 7.6 per cent for New Zealand as a whole.
Highest qualification
The attainment of academic and vocational qualifications was broadly similar for the DTLB area and the peninsula.
The proportion of those with the highest incidences of qualifications at NZQA levels one to four was in Bayswater, and at levels five and six in Devonport.
The proportion of people holding bachelors degrees and other level-7 qualifications was highest in Hauraki (24.2 per cent) compared to the DTLB area (22.9 per cent). Stanley Point had more postgraduate and honours degrees (13.7 per cent) than the DTLB (9.2 per cent); Cheltenham (11.7 per cent) and Devonport (10.6 per cent) had more holders of masters degrees than the DTLB area (7.3 per cent); and Cheltenham had 3.5 per cent with a doctorate compared to 1.4 per cent in the DTLB area.
high incomes in Devonport.
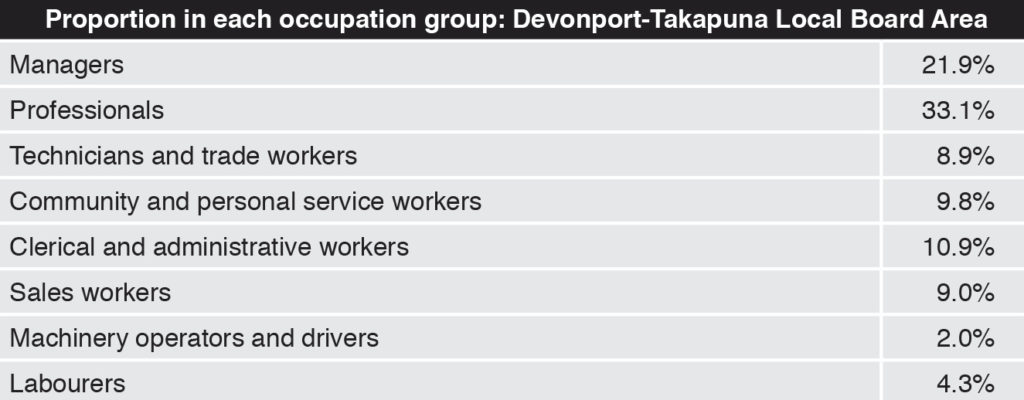
Employment and occupations
Overall, 49.9 per cent of the DTLB area was in full-time employment, a similar pro- portion to Auckland (51.9 per cent) and New Zealand as whole (50.1 per cent).
Stanley Point had the peninsula’s highest rate of full-time employment (57.8 per cent), while Cheltenham had the lowest (45.2 per cent), as well as the highest level of non-participation in the labour force (35.3 per cent).
The DTLB area has a similar proportion of ‘community and personal service’, ‘clerical and administrative’ and ‘sales’ workers to the rest of Auckland and New Zealand.
Stanley Point (20.6 per cent) and Belmont (13.5 per cent) had higher incidences of community and personal service workers, likely due to the presence of the Navy in those areas.
The DTLB area had higher proportions of ‘managers’ and ‘professionals’ than the rest of Auckland and New Zealand, and this is exemplified on the peninsula, particularly in Narrow Neck with 25.7 per cent working as managers, and in Cheltenham and Devonport with 46 per cent and 40.7 per cent respectively working as professionals.
Hauraki, Belmont. Bayswater and Stanley Point had comparable proportions of ‘technicians and trade workers’ to the rest of the DTLB area.
Housing ownership
The peninsula had a total of 8403 private dwellings, of which 8 per cent were unoccupied at the time of the 2018 Census.
Stanley Point had the highest levels of home ownership (50.7 per cent) and holdings in a family trust (28.8 per cent), compared to 43.1 per cent and 21.1 per cent respectively for the DTLB area.
Bayswater had the lowest proportion of ownership (39.6 per cent) and Belmont the lowest holding in a family trust (18.5 per cent).
Rental costs
The median weekly rent of $530 in the DTLB area increased 26.2 per cent on the 2013 level of $420.
The biggest rent increase on the peninsula was in Belmont (up 24.3 per cent since 2013 to $460 from $370). The highest median rents in 2018 were in Stanley Point ($600), Devonport ($520) and Hauraki ($510).
Comparing median income, with median rent is a crude illustration of rental afford- ability on the peninsula.
In Stanley Point, the median rental cost was 65.3 per cent of median personal in- come, followed by Devonport and Hauraki at around 59 per cent.
The lowest and most affordable rentals compared to median income were in Bayswater ($270 per week).
This article originally appeared in the 24 April 2020 edition of the Flagstaff. Read online here.

Please consider supporting The Devonport Flagstaff by clicking here: